World Cup Star Suffers Injury Hours After £34m Liverpool Move
World Cup star suffers injury just – Just hours after completing a high-profile transfer to Liverpool for £34 million, Spain’s top World Cup performer has been forced to withdraw from competition. The injury, which occurred shortly after the player’s arrival at the club, has cast a shadow over his international prospects and raises concerns about his readiness for Spain’s next crucial matches.
A Dramatic Transfer and Immediate Setback
The player, who had been set to join Newcastle United, saw his plans shift dramatically when Liverpool activated a £34.6 million release clause. This move came as a surprise to many, but the timing of his injury just after finalizing the deal has added to the drama. Spain’s national team now faces uncertainty in their upcoming fixtures, with the player’s availability hanging in the balance.
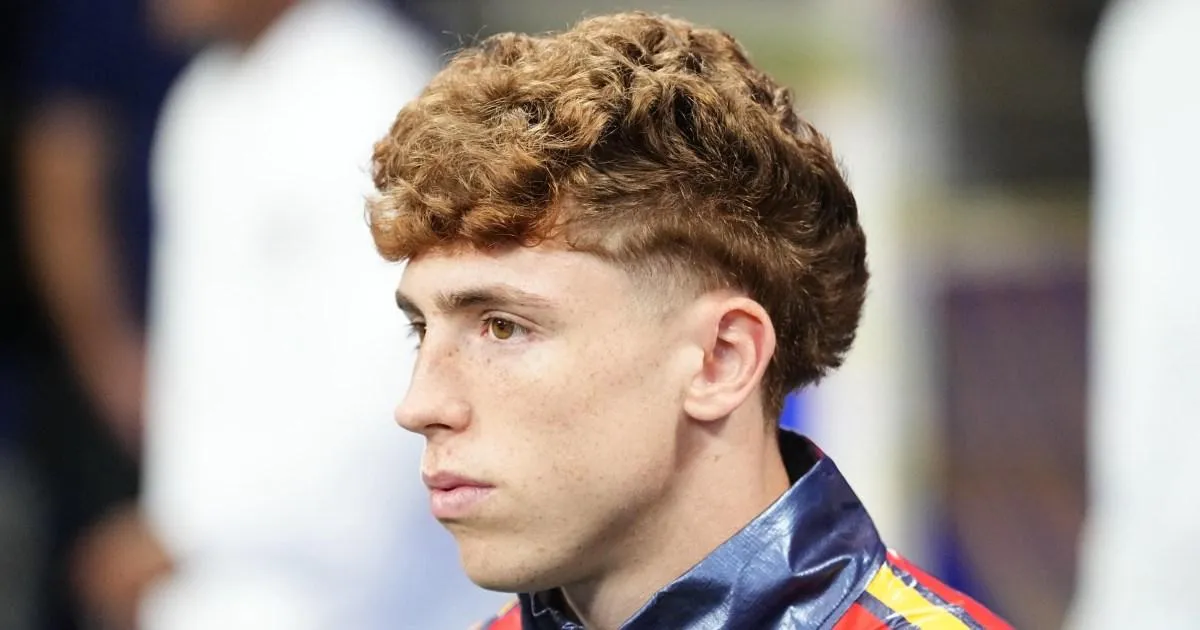
Victor Munoz, the 22-year-old forward, had already been making headlines for his performances in the World Cup. His injury, a fresh muscle tear, emerged during his recovery phase after a previous calf issue. The new setback means he will miss Spain’s Group H clash against Saudi Arabia, a game vital for maintaining their position in the tournament.
Recovery Challenges and Team Dynamics
Following his transfer to Liverpool, Munoz underwent a medical evaluation in the United States. The process was anticipated to be smooth, but the sudden injury has disrupted his progress. Medical experts suggest the muscle injury may require a longer recovery period, leaving questions about his ability to compete in the upcoming matches.
“The injury has occurred during his recovery process, which was expected to be manageable,” said a statement from the Spanish Football Federation. “Munoz’s return to play will depend on his rehabilitation schedule and the team’s tactical needs.”
While the transfer to Liverpool was a significant step in Munoz’s career, the injury adds pressure to his performance. Fans and analysts are now questioning whether the player will be fit for the 2026/27 Premier League season, particularly as Liverpool will face Newcastle – the club he nearly joined – in their first match of the campaign.
Lamine Yamal Faces Own Fitness Concerns
Spain’s other key player, Lamine Yamal, has also encountered challenges. The 18-year-old Barcelona star, known for his exceptional talent, has been sidelined by a hamstring injury since the tournament began. His potential role in the upcoming Group H game remains uncertain, with his coach weighing the decision to include him or not.
“I’m ready for whatever the coach wants, but I’m not up for a full match,” Yamal admitted in a recent interview. “The injury has taken time to recover from, and I’m still adapting to the demands of the World Cup.”
Yamal’s situation underscores the difficulties young athletes face in high-stakes competitions. Though he has shown promise in limited appearances, the decision to start him in Spain’s critical game against Saudi Arabia will hinge on his physical condition and the team’s strategic choices.
Looking Ahead: A Tumultuous Path for Spain
As the World Cup progresses, Spain’s roster is under scrutiny due to the injuries affecting two of its most promising forwards. The timing of Munoz’s setback, just after his transfer, has created an unexpected hurdle for the team’s campaign. With both players sidelined, Spain must rely on other options to secure their position in the tournament.
Analysts are speculating on the implications of these injuries for the World Cup and the Premier League. Munoz’s move to Liverpool was seen as a strategic investment, but his current status raises questions about how his absence will impact Spain’s attacking options. Meanwhile, Yamal’s potential return could provide a spark for the team’s younger generation.